 FAO Map Catalog
"BMGF-AWS"
Type of resources
Available actions
Topics
Keywords
Contact for the resource
Provided by
Representation types
Update frequencies
status
Scale
-
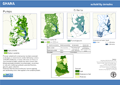
This map shows areas suitable for the Agricultural Water Management interventions as identified by the project. The assessment is based primarily on each intervention's bio-physical requirements (such as: climate, proximity to water resources, terrain), but it also includes a qualitative rating based on infrastructural settings (namely distance to markets).
-
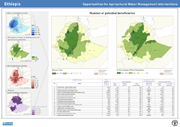
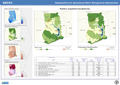
The potential for investment in agricultural water management (AWM) in support to rural livelihoods is assessed as a function of the demand from rural population and the availability (supply) of the resource. This map shows the distribution of rural population who could benefit from water-related interventions. The level of demand is based on the analysis of the livelihood zones, combined with poverty level. The supply is a function of availability of water, calculated on the basis of water (Internal renewable water resources) per person, with water development being constrained below the threshold 1700 m3/p.
-
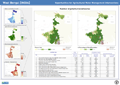
This map shows where AWM can be the entry point for improving livelihoods and where to prioritize investments in AWM to have the maximum impact on rural livelihoods. High potential areas are those showing the highest potential for AWM investment. These areas are identified on the basis of three guiding principles: 1) where water is available 2) where the target beneficiaries are mostly located; and 3) where agricultural water management is key for livelihoods.
-

This map shows areas suitable for the Agricultural Water Management interventions as identified by the project. The assessment is based primarily on each intervention's bio-physical requirements (such as: climate, proximity to water resources, terrain), but it also includes rating based on socio-economic settings or infrastructure (namely distance to markets). Details of criteria and threshold used are given in the downloadable files.
-
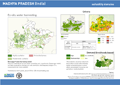
This map shows areas suitable for the Agricultural Water Management interventions as identified by the project. The assessment is based primarily on each intervention's bio-physical requirements (such as: climate, proximity to water resources, terrain), but it also includes a qualitative rating based on socio-economic settings (namely distance to markets).
-

This map shows areas suitable for the Agricultural Water Management interventions as identified by the project. The assessment is based primarily on each intervention's bio-physical requirements (such as: climate, proximity to water resources, terrain), but it also includes rating based on socio-economic settings or infrastructure (namely distance to markets). Details of criteria and threshold used are given in the downloadable files.
-

This map shows where AWM can be the entry point for improving livelihoods and where to prioritize investments in AWM to have the maximum impact on rural livelihoods. High potential areas are those showing the highest potential for AWM investment. These areas are identified on the basis of three guiding principles: 1) where water is available 2) where the target beneficiaries are mostly located; and 3) where agricultural water management is key for livelihoods.
-
This map shows where AWM can be the entry point for improving livelihoods and where to prioritize investments in AWM to have the maximum impact on rural livelihoods. High potential areas are those showing the highest potential for AWM investment. These areas are identified on the basis of three guiding principles: 1) where water is available 2) where the target beneficiaries are mostly located; and 3) where water is key for livelihoods.